Housing Figures: Home Price Growth at a 15-Year High
May 27, 2021

Housing Figures is our monthly round-up of the top news stories related to residential new construction spending and the latest market numbers.
Pricing continues to escalate as the latest numbers show the largest home price growth since 2005. Meanwhile, new home sales and housing starts decreased in April, impacted by building material prices. Still, builders showed confidence in May thanks to a demand environment. We also look at multifamily market sentiment and how townhome construction has continued to perform well.
New home sales impacted by high building costs
Building material prices took their toll on April new home sales. Record high building material prices were a factor in new home sales, decreasing to a seasonally adjusted annual rate of 863,000 in April. That number is 5.9 percent lower than March’s revised rate. April’s new home sales are about double the amount of April 2020’s estimate of 582,000 units, when shutdowns were in full swing. Still, a Zillow economist said that even with the recent slowdown, the current pace of sales is on track to exceed the new homes sold in 2019 (683,000). [HousingWire]
The Pending New Home Sales Index held steady, however. The Zonda New Home PSI held steady month-over-month in April, falling only 0.1 percent from March to 161.3. On a year-over-year basis, that represents a nearly 79 percent increase from a weak April 2020, and an almost 50 percent increase from April 2019. These figures differ from the Census Bureau because the New Home PSI is based on new home orders and the average sales rate per community. The top performing markets included Las Vegas, San Francisco and Riverside/San Bernardino. [Builder]
Multifamily sentiment improves in Q1, townhouse construction stays strong
Confidence in the multifamily market increased in the first quarter. The National Association of Home Builder’s latest Multifamily Market Survey found that confidence in the multifamily market increased in both the Multifamily Production Index and the Multifamily Occupancy Index. The Multifamily Production Index increased by eight points to 51 — the first time the index has been over 50 in seven quarters. The Multifamily Occupancy Index increased by one point to 59. One developer said they continue to see strong demand for rental housing, particularly in the suburbs. [NAHB Now]
Also in the first quarter: townhouse construction continued at a strong pace. An NAHB analysis of Census Bureau data showed that townhouse construction had a good showing in the first quarter of 2021. That activity followed the best quarter for townhouse construction in 2.5 years at the end of 2020. The market share of new townhouses among total attached single-family starts rose to 11.9 percent, and demand for medium density neighborhoods is expected to pick up as the U.S. economy opens up again. [Eye on Housing]
The highest home price growth in 15 years
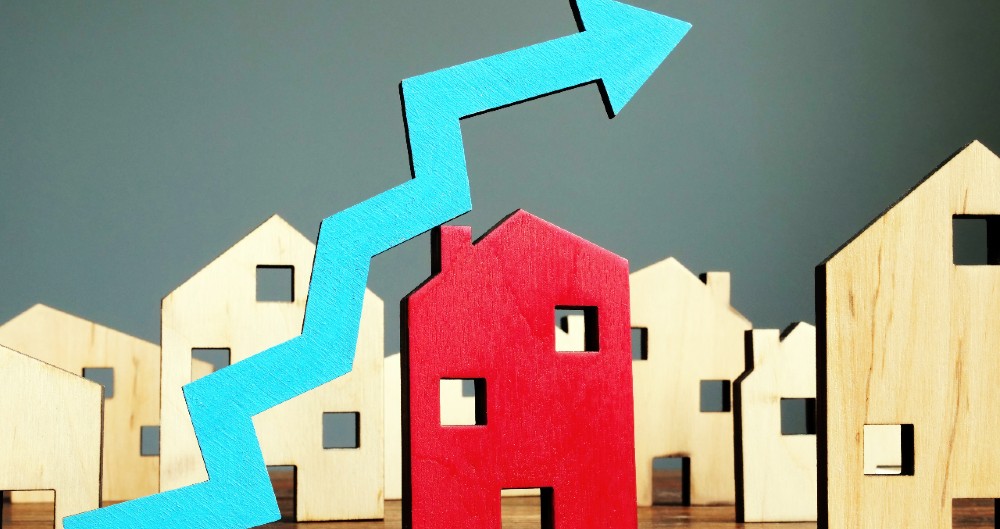
Home prices continued to increase in March, reaching near-record levels. March home prices were 13.2 percent higher than March 2020 according to the latest S&P CoreLogic Case-Shiller home price index. That percentage is higher than February’s 12 percent annual gain. It also marks the 10th consecutive month of rising home prices. The increase is the largest since December 2005 as strong demand competes with record low supply. [CNBC]
Here are the states where home prices rose the most. Among the 20 cities the S&P CoreLogic Case-Shiller index measures, Phoenix experienced the largest annual price increase at 20 percent. San Diego followed with an approximately 19 percent increase, while Seattle came in third with a roughly 18 percent increase. The index of home prices across all 20 cities, compared to the national index, rose at an annual pace of 13.3 percent. [Realtor.com]
Not yet a HomeSphere partner?
HomeSphere connects residential construction builders with building product manufacturers to facilitate long-lasting relationships through our award-winning software platforms, My HomeSphere® and HomeSphere-IQ®.
Housing starts drop, as permits rise
U.S. home building decreased more than expected in April. Housing starts, also impacted by materials prices, decreased by 9.5 percent in April to a seasonally adjusted annual rate of 1.569 million units. March data was revised to 1.733 million units, down from 1.739 million units. Compared to April 2020, starts rose 67.3 percent. Regionally, starts decreased in the Midwest and South, and rose in the Northeast and West. Meanwhile, permits rose 0.3 percent to an adjusted rate of 1.760 million units. Permits rose nearly 61 percent on a year-over-year basis. [CNBC]
Residential construction spending slightly higher than February
Spending on residential construction increased in March. The latest Census numbers indicate residential construction came in 1.7 percent above February’s rate. For March, that represents a seasonally adjusted annual rate of $725.2 billion. Total construction, including private and public, came in 0.2 percent higher than February at an adjusted annual rate of $1.513.1 billion. [Reuters/Census Bureau]
Builders still confident despite lingering concerns
Home builders continue to report a demand environment as pricing power remains. A record percentage of home builders reported raising most or all base prices in April, as all respondents reported increased materials costs. Seventy-two percent of builders also reported annual increases in sales, while only 12 percent saw decreases. Seventy-six percent, a survey record high, reported better year-over-year traffic as well — which is expected when compared to April 2020. [HomeSphere]
Despite costs, home builders remained confident in May. The most recent NAHB/Wells Fargo Housing Market Index remained unchanged from April at 83. Confidence stayed high despite cost concerns and lot availability thanks to a limited resale inventory and low interest rates, among other things. While the pool of prospective homebuyers is growing, first-time homebuyers are being particularly impacted by rising prices. [HBS Dealer]


