Demand Trends Continue to Decline for Private Builders
September 19, 2023
In the latest HomeSphere/BTIG State of the Industry Report private builders are still seeing demand trends decline, likely due to higher interest rates.
Private builders are not seeing the typical robust selling season this summer compared to public builders. In this month's report, private builders point to interest rates being the culprit. In addition, BTIG noted private builders tend to build homes at a higher price point compared to public builders, contributing to low demand brought on by higher interest rates.
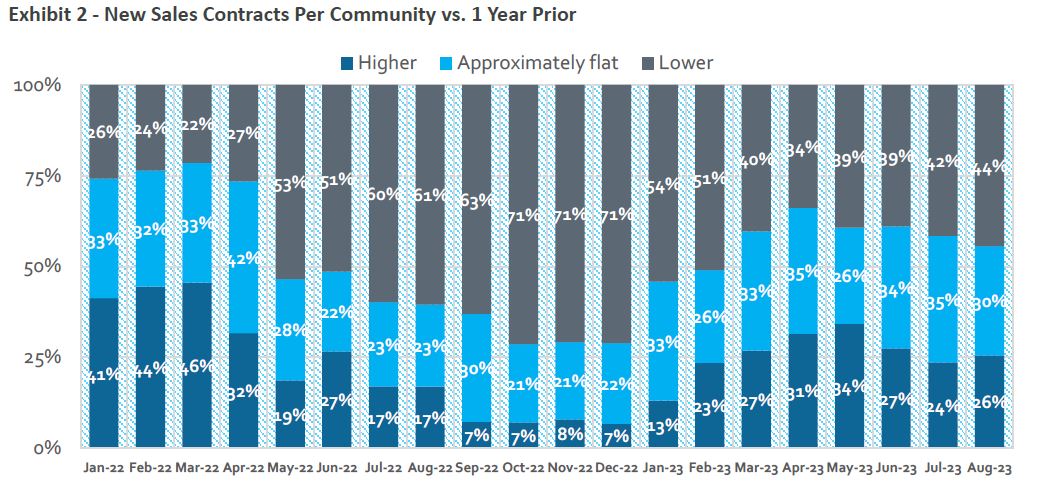
Sales increased slightly to 26% from 24% in July, however 44% of builders reported a decrease, compared to 42% the previous month. In parallel, private builders are seeing a decline in traffic, with 40% reporting a decrease and only 21% seeing an increase. In July traffic was roughly the same at 31% and 30%.
However, virtual sales tools have improved the quality of traffic as builders report homebuyers are more prepared with pricing and needs already determined. Sales and traffic expectations remained balance in August, but worse than July. Twenty-eight percent reported sales as better than expected, compared to 31% in July and 25% reported sales worse than expected, slightly up from 24% in July.
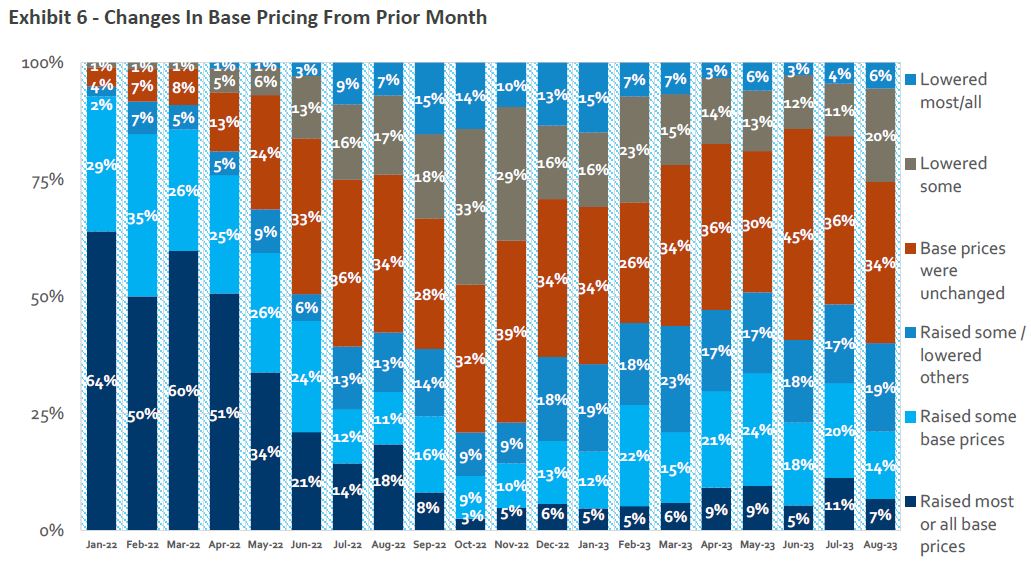
Pricing and incentives remain mixed, with 21% of private builders reporting raising prices and 26% report lowering prices. Private builders continue to monitor prices and incentives, as 31% reported raising incentives and 5% lowered their incentive offering.
The latest NAHB/Wells Fargo Housing Market Index (released Sept. 18, 2023) came in at 45, another drop as demand trends continue to decline.
Highlights from the latest State of the Industry Report
Sales trends sluggish but consistent with July; traffic worsens sequentially. 26% of respondents reported year-over-year increases in sales orders per community vs. 24% last month and 17% in August 2022. 44% saw a year-over-year decrease in orders vs. 42% last month and 61% for the same month last year. 21% reported an increase in year-over-year traffic at communities; 40% saw a decline vs. 30% and 31%, respectively, last month.
Sales and traffic performance relative to internal expectations were balanced in August, but worse than July. 28% of respondents saw sales as better than expected; 25% saw sales as worse than expected (positive spread of +3). Last month, 31% of respondents saw sales better than expectations and 24% saw worse (positive spread of +7). 19% of builders saw traffic as better than expected, while 20% of builders saw traffic as worse than expected (negative spread of -1). This compares to 31% and 24%, respectively, last month (pos. spread of +7).
Builder pricing activity and the use of incentives remains mixed. 21% of builders reported raising either "most/all" or "some" base prices vs. 31% last month, while 26% of builders lowered "most/all" or "some" base prices vs. 15% last month. 31% of respondents reported increasing "most/all" or "some" incentives vs. 29% last month, while only 5% reported decreasing "most/all" or "some" incentives vs. 6% last month.
HomeSphere/BTIG State of the Industry Report
HomeSphere partners with the global investment bank BTIG to create a monthly report to provide our builders and manufacturers with exclusive and timely insights about the market.
To compile the report, we survey HomeSphere’s 2,700+ regional and local home builders about sales, traffic, pricing, labor costs and other key industry metrics.
How to get the monthly report
If you are a builder and would like to participate and receive the monthly report for free, request an invitation below:

