Healthy Business Conditions Reported Heading Into Spring
April 18, 2024
In the latest HomeSphere/BTIG State of the Industry Report, sales and traffic trends remained healthy from February to March.
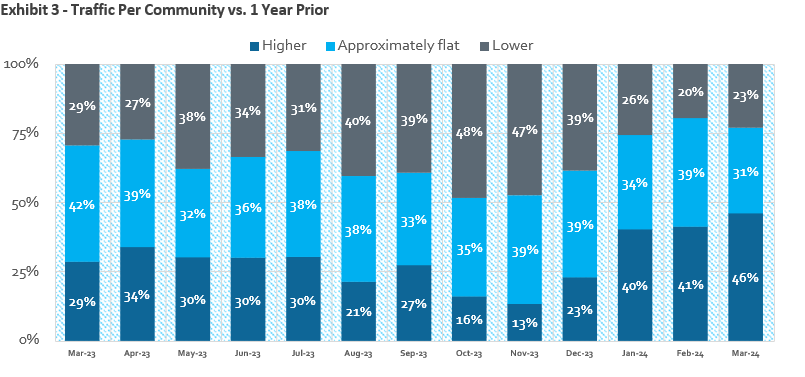
As private builders move into the spring selling months, they reported a year-over-year increase in sales and traffic. Forty one percent of respondents reported increases in sales orders per community versus 40% last month and 27% in March 2023. In addition, for the fourth straight month, traffic trends increased. Forty-six percent of builders reported year-over-year growth in community traffic versus 29% in March 2023.
BTIG furthers reports: "Overall, these results are largely positive and the current operating environment remains buoyed by a lack of existing home inventory."
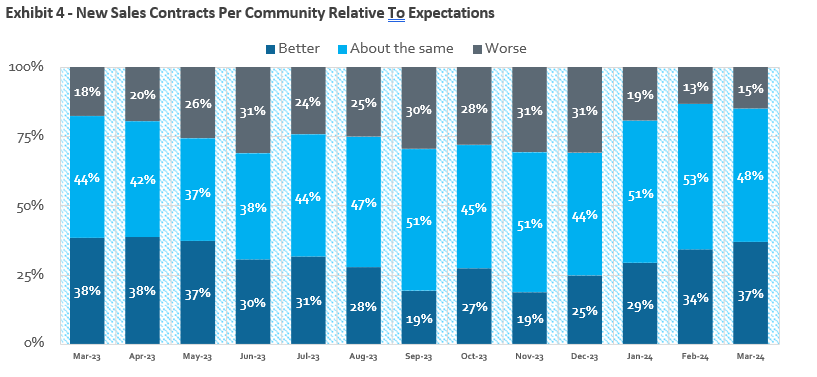
Sales relative to expectations and traffic relative to expectations continue to be more positive than negative. Thirty-seven percent of respondents saw sales as better than expected; 37% of builders saw traffic as better than expected.
The latest NAHB/Wells Fargo Housing Market Index (released April 15, 2024) came in at 51.
Highlights from the latest State of the Industry Report
March sales and traffic indicators remain healthy. 41% of respondents reported yr/yr increases in sales orders per community 40% last month and 27% in March 2023. 22% saw a yr/yr decrease in orders vs. 19% last month and 40% for the same month in 2023. 46% of builders reported an increase in yr/yr traffic at communities and 23% saw a decline vs. 41% and 20%, respectively, last month and 29% and 29%, respectively, in March 2023.
Sales and traffic performance relative to internal expectations continues to be more positive than negative. 37% of respondents saw sales as better than expected; 15% saw sales as worse than expected (positive spread of +22). Last month, this spread was +21. 37% of builders saw traffic as better than expected, while 17% of builders saw traffic as worse than expected (positive spread of +20). This compares to 36% and 13%, respectively, last month (positive spread of +23).
Pricing and incentive activity continues to be mixed. 29% of builders reported raising either "most/all" or "some" base prices vs. 30% last month. 8% lowered "most/all" or "some" base prices vs. 14% last month. 19% reported increasing "most/all" or "some" incentives 18% last month, while 5% of builders reported lowering "some" or "most/all" incentives vs. 9% last month.
HomeSphere/BTIG State of the Industry Report
HomeSphere partners with the global investment bank BTIG to create a monthly report to provide our builders and manufacturers with exclusive and timely insights about the market.
To compile the report, we survey HomeSphere’s 2,700+ regional and local home builders about sales, traffic, pricing, labor costs and other key industry metrics.
How to get the monthly report
If you are a builder and would like to participate and receive the monthly report for free, request an invitation below:

