Partner Scorecard
What is the Partner Scorecard?
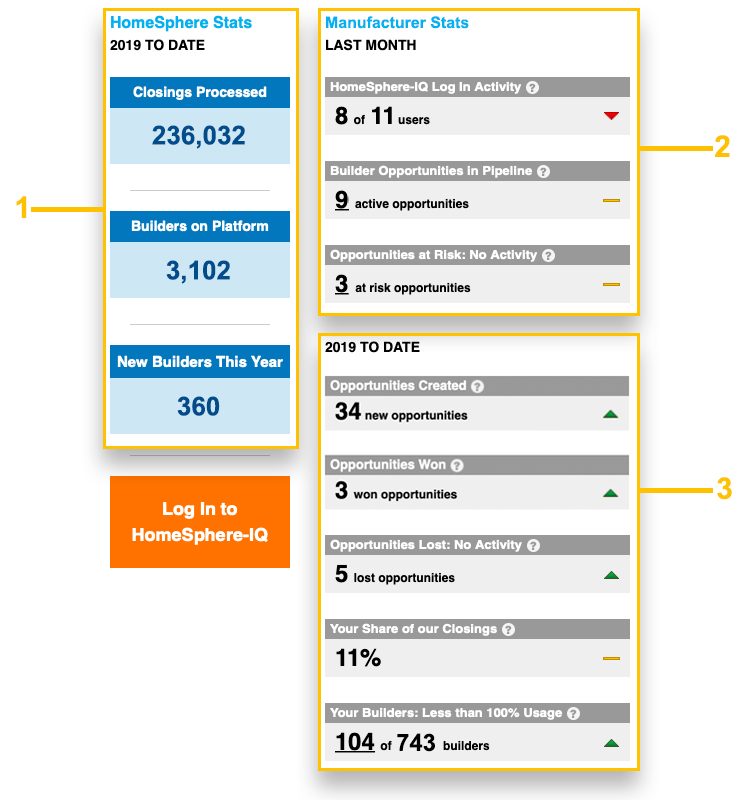
The Partner Scorecard is an e-mail report for HomeSphere manufacturers. The Scorecard contains a set of powerful metrics that help you and your team get the most value possible from your HomeSphere program. The Scorecard also displays trending information based on the previous period.

What are the metrics displayed?
-
HomeSphere metrics reported year-to-date
- Total closings processed
- Total builders on the HomeSphere platform
- New builders that have joined this year
-
Your organization’s metrics reported month-over-month
- Your team’s HomeSphere-IQ log in activity
- Active opportunities in your pipeline
- Opportunities with no update in 30 days
-
Your organization’s metrics reported year-to-date
- Other information:
Your team’s HomeSphere-IQ log in activity
What does it mean?
This metric shows you how many of your team members logged in to HomeSphere-IQ last month against the total number of users you have given access to.
How do I use this?
This metric tells you how engaged your team is with HomeSphere, and with the HomeSphere-IQ platform. If your team is not using the platform to its full potential, this is an opportunity to reach out to your HomeSphere Partner Manager to set up additional training sessions.
Active opportunities in your pipeline
What does it mean?
This metric shows how many open new business opportunities you had in your pipeline as of the end last month. This represents what is currently available for your team to sell and close.
How do I use this?
This metric tells you about your new business pipeline. If your team has a large pipeline, you should touch base them to ensure all new business opportunities are being worked efficiently and kept up-to-date inside of HomeSphere-IQ. To view your pipeline, use the LEADPLUS feature inside HomeSphere-IQ.
Opportunities with no update in 30 days
What does it mean?
This metric shows how many of your new business opportunities were not touched or updated by your team last month (no notes or status changes).
How do I use this?
This metric tells you how much of your pipeline is at risk of expiring due to inactivity. If a large percentage of your pipeline has not been updated in the last 30 days, touch base with your team to ensure they are proactively managing their new business opportunities.
New opportunities received
What does it mean?
This metric shows how many new business opportunities your team has received so far this year.
How do I use this?
To view and manage your team’s new business opportunities, use the LEADPLUS feature inside HomeSphere-IQ.
Won opportunities
What does it mean?
This metric shows how many opportunities your team has won so far this year.
How do I use this?
To view the new business opportunities that have been won and the value of those opportunities, use the LEADPLUS feature inside HomeSphere-IQ.
Opportunities lost due to inactivity
What does it mean?
This metric shows how many new business opportunities were closed as lost because no action was ever taken with the builder.
How do I use this?
This metric tells you if you are losing new business due to lack of action or follow-up. If you have a large number of opportunities that were lost because of inactivity, touch base with your team to find out why these new business opportunities are falling through the cracks.
You can also work with HomeSphere Partner Manager to ensure your team is fully trained to use HomeSphere-IQ.
Your share of total closings processed
What does it mean?
This metric shows you how many closings submitted by HomeSphere builders have at least one of your products on them.
How do I use this?
This metric tells you what your current share of the HomeSphere builder community is.
Builders with less than 100% usage of your product
What does it mean?
This metric shows you how many of your HomeSphere builders did not report installing your product in every closed home.
How do I use this?
This metric shows your opportunity to grow incremental revenue inside of your existing customer base. Your team should call on these customers to uncover why they are not using your product 100% of the time in every home and correct it. This can also help alert you to potential issues with distribution. To access the names of these builders, use the Sales Analysis reports inside HomeSphere-IQ.
Trending Information
What does it mean?
To the right of each Scorecard metric, there is a trending graphic. The graphic tells you whether the metric displayed has improved (green up arrow), declined (red down arrow), or remained flat (yellow line) against the previous period (prior month or in the same period last year).
How do I use this?
Your trending information helps you see how your HomeSphere program is progressing over time.
What’s New in HomeSphere-IQ
How do I use this?
This section keeps you updated on the new tools and functionality added to HomeSphere-IQ on a regular basis.
Success Resources
How do I use this?
This section provides you with FAQs, demos, articles and more. These resources will help you and your team become HomeSphere-IQ power users!
Why doesn’t the data in my Scorecard match what’s in HomeSphere-IQ?
Many of the charts you see in HomeSphere-IQ (My Market Share and My Builders charts, for example) represent month-to-month data. The data shown in the Scorecard is cumulative over the current period. Use the data in the Scorecard to:
- Keep tabs on all sales opportunities available to you, both within your existing customer base and in your new business pipeline.
- Determine if your team needs additional training to use HomeSphere-IQ effectively.
- Monitor your team’s engagement with HomeSphere.
- Measure your HomeSphere program effectiveness over time.


